
Losses are visible too late
Combine meter, DMA and network information so abnormal demand and probable losses can be identified sooner.
See consumption, losses and network events in the same spatial picture.
A GIS-first, smart-meter-ready platform for water consumption, district metered areas, non-revenue water analysis, leaks, bursts, pressure, alerts, work orders and savings reporting.
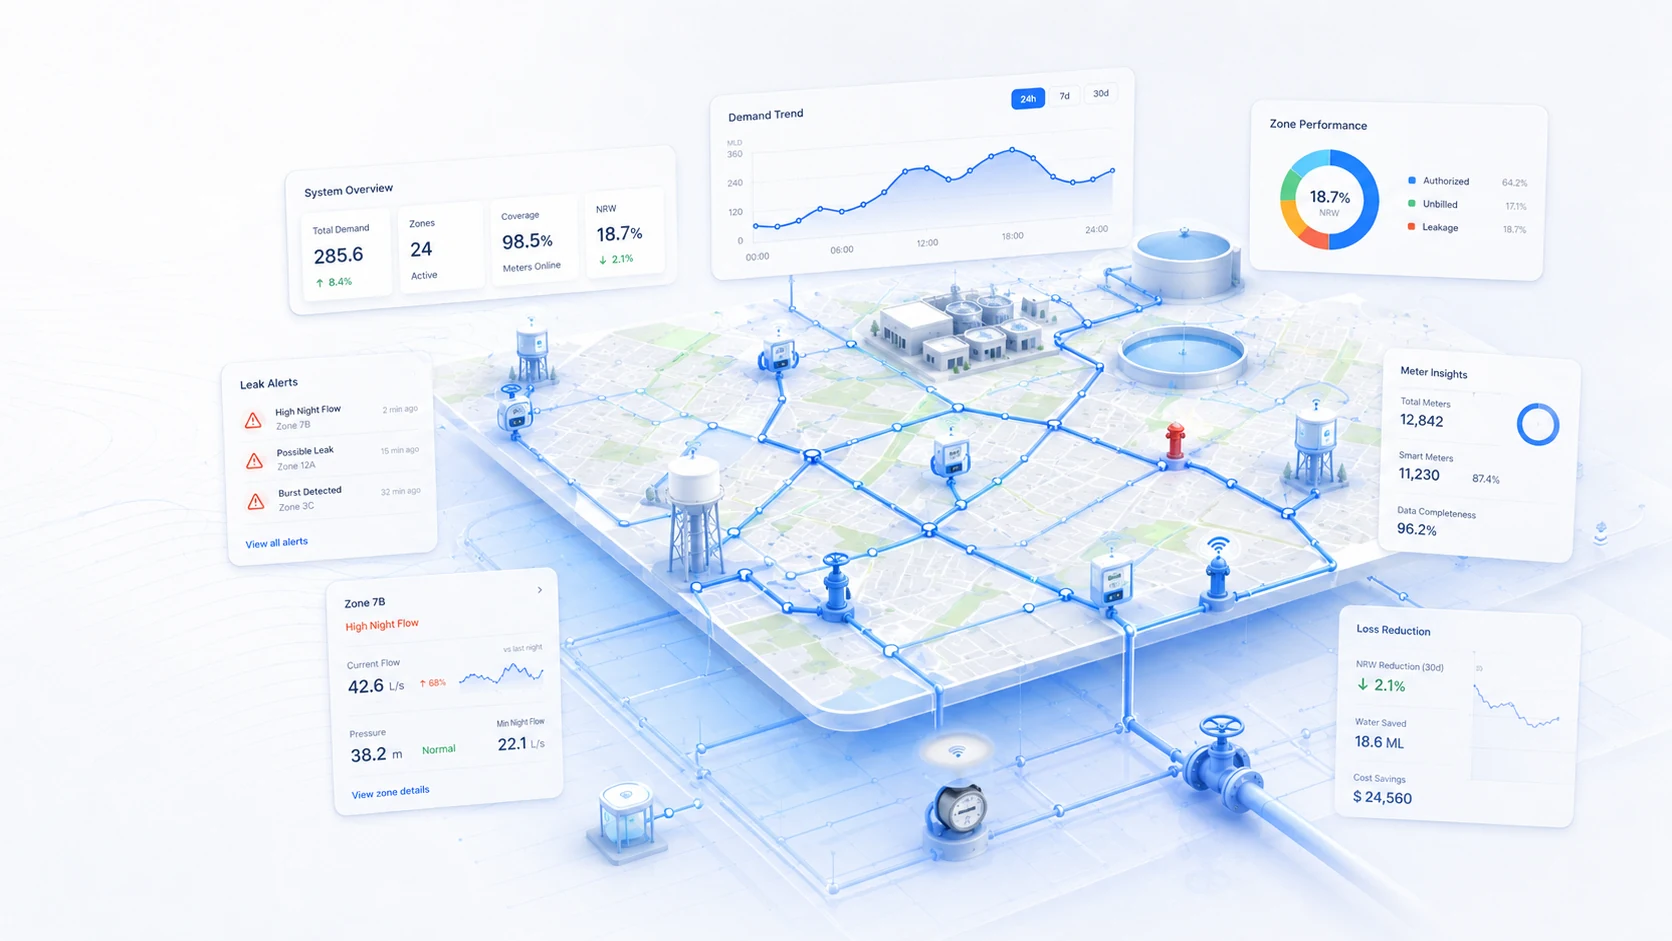
The system is designed around the decisions infrastructure teams need to make every day: what exists, where it is, what condition it is in, what requires attention and what happened next.
Combine meter, DMA and network information so abnormal demand and probable losses can be identified sooner.
Attach readings to customers, meters, zones, pipelines and operational areas in GIS.
Link alerts and field work to the water-loss event so the organisation can measure response and verified savings.
Modules can be adapted to the organisation's asset hierarchy, terminology, inspection methods, decision rules and reporting requirements.
Receive smart meter readings through APIs or IoT gateways and store time-series consumption against the correct meter and location.
Define district metered areas, inflows, customer demand, night flow and related network assets in GIS.
Compare supplied water with authorised consumption and known components to support non-revenue water investigation.
Apply thresholds and anomaly rules to flag unusual consumption, continuous flow, probable leaks or network events.
Incorporate pressure measurements where available to support pressure management and event diagnosis.
Create and track investigations, leak repairs, burst work and close-out evidence from alert to completion.
Analyse customer, area and time-based demand patterns, trends and exceptions for operational and planning use.
Track estimated and verified water savings, response times, recurring problem areas and programme performance.
Every module is designed to preserve the connection between the source evidence, the asset, the decision and the resulting work.
Meters, bulk meters, pressure sensors and manual data.
Check timestamps, meter identity, gaps and abnormal values.
Calculate demand, DMA balance, NRW indicators and anomalies.
Create alerts, investigations and repair work.
Measure post-repair demand and report savings.
The platform can start with a focused use case and grow over time. The architecture separates field capture, structured data, GIS, business logic, integration and reporting so each part can evolve without turning the system into a monolith.
Responsive web interfaces, field forms, dashboards and reporting.
Business rules, workflows, authentication, integrations and automation.
Structured relational data, asset history, documents and audit records.
GIS geometry, network context, mapping, spatial queries and location intelligence.
Existing enterprise systems, IoT feeds, imports, exports and BI tools.
We can configure the asset model, GIS, workflows, database, integrations, dashboards and reporting around your organisation instead of forcing your processes into a generic template.